PrettyMap on-screen buttons
 | open the menu (to load new maps and access other options) |
 | show all open maps ("zoom all") |
 | zoom in |
 | zoom out |
   | mode: pan / zoom area / measure distance |
 | switch to 2D/3D/spherical view, tap for a list of available choices |
 | view settings (also available in the menu) |
 | vector layers settings (also available in the menu) |
 | elevation settings (also available in the menu) |
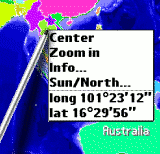 | tap on the map for context menu and additional options |
PrettyMap forms help
Note: Palm OS and Windows Mobile versions differ in available features.
| Opening maps (menu: Map/Open maps...) | |
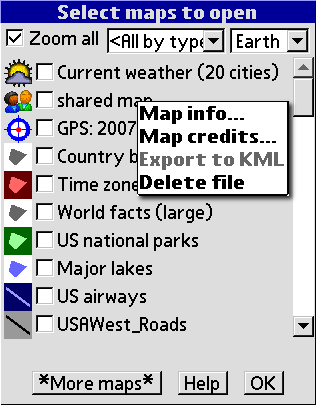
| Check maps to open and uncheck maps to close. Click icons or map names for additional options. The icons depict categories of maps. The right column describes map contents. If 'Zoom all' is checked, then after loading maps the zoom will be adjusted to show all map areas. Use the top middle list box to filter maps by category or to sort them alphabetically. |
| Loading and saving sessions (menu: Map/Load,Save session...) | |
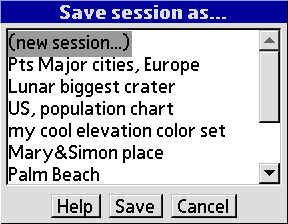
| A 'session' contains information about open maps and related parameters (like elevation colors, layer settings etc.). Later, you can quickly restore the program state that is saved in a session. To overwrite an existing session, select its name and press 'Save'. To create a new session, select '(new session)' and press 'Save', then enter the name for the new session. |
| Vector layers configuration (menu: Vector/Layers...) | |
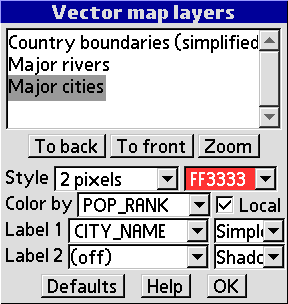
| This window lets you adjust vector map layers. Use 'To back' and 'To front' buttons to modify the order of drawing layers. Use 'Zoom' to automatically adjust the best zoom for the selected layer. The 'Style' control lets you hide a layer. If some data are available for the selected map, then you can add labels to map objects. For numeric properties simple bar charts can be drawn. In the global mode, bar widths reflect linearly normalized values: bar=(value–globalmin)/(globalmax–globalmin). In the local mode, normalization concerns only objects visible on screen: bar=value/visiblemax. If a numeric property is chosen, then the 'Color by' setting (and the 'Local' checbox) work analogously to the bar charts. They adjust colors of objects based on normalized values of the selected property. You can adjust the color gradient in the menu: Vector/Settings. The 'Defaults' button restores default settings for the currently selected layer. Advanced users can adjust default settings and much more by editing the configuration file stored on the card. You can also create your own maps (layers) with locations of your interest. Click the 'User' button and select 'Create new map' to create a new vector map with points. Then click 'Properties' to set the map name or click 'Locations' to edit data and coordinates. |
| Quiz mode (menu: Vector/Quiz...) | |
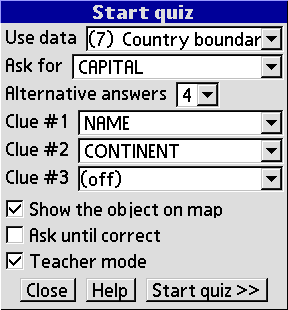
| First select the map you want to use for the quiz. Then select the property that you will be asked for, and the number of choices. You can specify clues (these are properties that will be given to help you answer the question correctly). The 'Show object on map' option will locate and display objects that you are asked for. In the 'Teacher mode', PrettyMap will ask you more often for objects that you have problems with. Good luck! |
| Data search (menu: Vector/Data search...) | |
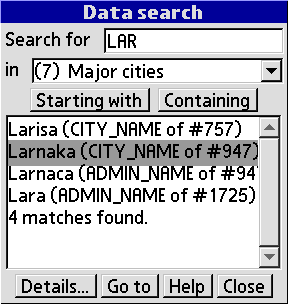
| Most vector maps contain a database of object descriptions (like names, population sizes, temperatures, etc). For each map, the number in parentheses indicates the number of data features available for search. You can search each database, just enter the search term, select the map you want to examine, and press 'Start search'. Once the search is complete and some objects are found, you can select an object and press 'Details' to learn more about it, or press 'Go to' to locate the object on the map. On editable layers, you can also directly edit records that have been found. |
| Elevation custom colors (menu: Settings/Elev. user colors) | |
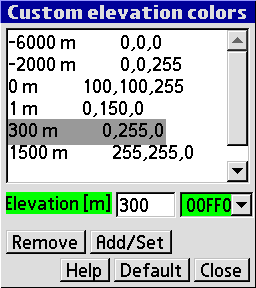
| This window lets you customize elevation levels and the corresponding colors. To ensure that your elevation levels reflect real elevations, set the menu:Settings/Elev.advanced/Color scale to Absolute. Press 'Remove' to remove the selected level. 'Add/Set' adds a new level if there is no level with the same elevation, otherwise it updates colors for the existing level. Press 'Default' to restore original settings. |
| User-defined maps and weather forecasts (menu: Vector/Layers/User/Locations...) | |
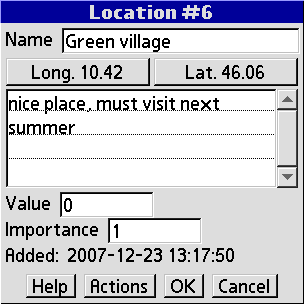 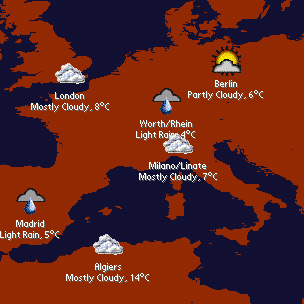
| This window displays data related to a single location. Press the 'Lon' and 'Lat' buttons to set longitude and latitude coordinates manually. Below you can enter notes for this place. The 'Value' field is an optional number that you can use to display bar charts on this map, or adjust point colors proportionally to this value. The 'Importance' field can also be used for this purpose, but it has additional meaning: locations with higher importance are displayed first. Use the 'Value' and 'Importance' fields to store values associated with this place (like area, height, size, population, quality, worth, attractiveness, etc.). Note that the precision of floating point numbers is limited, especially for huge values. You can use simple HTML tags like <b> (for bold text) and <u> (for underline) in the description. These tags will affect the description displayed in the 'Location info' window. If your device is connected to the Internet, you can get current weather, weather forecasts, wind, humidity, sunrise/sunset information and much more. Just go to weather.yahoo.com, locate the city of your interest, and get its ID that is displayed in the browser address bar (for example, for Rome in Italy the ID is ITXX0067). Then enter this ID preceded by the dollar sign (e.g. $ITXX0067) in the 'Name' field and press 'OK'. That's it! You can have many locations on a map with current weather displayed. Moreover, you can define custom labels for weather, see Menu: Vector/Weather. If you want to change units for temperature (Fahrenheit or Celsius), adjust Menu: Settings/General: Unit (mile or kilometer). Your mobile device can be used in the field to gather geo–referenced information, synchronize it with the central server (so that many people can do this work), see these locations on the web, access in desktop applications and even edit relational databases right on the PDA. Contact us if you need those advanced features. |
PrettyMap settings reference
See below for the list of settings, available choices and their descriptions. Default values are emphasized.
menu: Settings/General
Settings from this section are automatically saved when you exit PrettyMap, and loaded when PrettyMap starts.
| Font Large Bold / Large / Medium Bold / Medium / Small Bold / Small / Tiny Bold / Tiny | Select a font used to print names of objects on vector maps. |
| Unit kilometer / mile / nautical mile / degree.fraction / degree'min"sec | Specifies units used in PrettyMap to display dimensions. |
| Time offset −11 hours / −10 hours / −9 hours / −8 hours / −7 hours / ... | Should reflect the offset for your time zone relative to GMT, plus daylight saving offset, if any. The correct value should be set in your system preferences. This setting is used to accurately compute the "Day and night" display and for other sun–based features. (not saved) |
| Screen width [cm] 3 / 4 / 5 / 6 / 8 / 10 / 15 | This value is only used to display the scale of the view. |
menu: Settings/Buttons
Settings from this section are automatically saved when you exit PrettyMap, and loaded when PrettyMap starts.
| On-screen icons Auto / Small / Medium / Large | This setting affects the size of the screen buttons on the top button bar. You need to restart PrettyMap to see changes after this setting has been modified. |
| Calendar button | Choices: (no action) / Zoom in / Zoom out / Zoom all / Pan left / Pan right / Pan up / Pan down / Toggle grid / Toggle day&night / Toggle flat/relief/3D/Sphere / View settings / Vector layers settings / Elevation settings / Quick find |
| Contacts button | Choices: (no action) / Zoom in / Zoom out / Zoom all / Pan left / Pan right / Pan up / Pan down / Toggle grid / Toggle day&night / Toggle flat/relief/3D/Sphere / View settings / Vector layers settings / Elevation settings / Quick find |
| Tasks button | Choices: (no action) / Zoom in / Zoom out / Zoom all / Pan left / Pan right / Pan up / Pan down / Toggle grid / Toggle day&night / Toggle flat/relief/3D/Sphere / View settings / Vector layers settings / Elevation settings / Quick find |
| Notes button | Choices: (no action) / Zoom in / Zoom out / Zoom all / Pan left / Pan right / Pan up / Pan down / Toggle grid / Toggle day&night / Toggle flat/relief/3D/Sphere / View settings / Vector layers settings / Elevation settings / Quick find |
menu: Settings/View
Settings from this section are stored in individual sessions that you can save and restore at any time.
| Show grid No / Sparse / Dense | Displays the longitute/latitude grid. |
| Show degrees + and − / N,E and S,W | How degree values are displayed: as positive and negative values, or North/South/East/West symbols. |
| Background color | color |
| Day and night Hide / Night dashed / Night shaded / Day dashed / Day shaded | Shows and automatically updates the day/night area for Earth maps. 'Shaded' may be slow for large areas. See also menu: Settings/General/Time offset. |
| Hue Normal / Darker / Brighter / More red / More green / More blue / Negative | Changes overall colors of the raster map. (not saved in sessions) |
menu: Settings/GPS
Settings from this section are automatically saved when you exit PrettyMap, and loaded when PrettyMap starts.
| GPS port Don't use / Bluetooth / Cradle / USB / IrCOMM | If you have a GPS unit available, select the connection method here. (not saved) |
| Follow GPS No / Yes | PrettyMap can automatically move the map so that the GPS location is always visible. |
| Altitude Hide / Show | Current altitude and the number of satellites in view can be displayed below the GPS mark. |
| Log locations No / Every 15 seconds / Every 30 seconds / Every minute / ... | If activated, PrettyMap will create a map with GPS locations logged at the time intervals specified. (not saved) |
| Tracking service Off / Every 2 minutes / Every 5 minutes / Every 10 minutes | This is how often PrettyMap reports your current location to the PrettyMap server. An internet connection is required for this feature. Read more at prettymap.mooncoder.com/tracking.html (not saved) |
| Fleet ID (integer value) | The ID for your fleet. Use 0 for testing. Zero is a public, shared ID so that everybody using this ID can see their locations. Read more at prettymap.mooncoder.com/tracking.html |
menu: Settings/Elevation
Settings from this section are stored in individual sessions that you can save and restore at any time.
| View Flat / Relief / 3D model, solid / 3D model, lines / Spherical / Spherical relief | 'Relief' produces an impressive shaded view of the surface and requires an elevation map to be loaded. '3D model' displays a three–dimensional terrain model and requires an elevation map to be loaded. 'Spherical' projects a map onto a sphere. Vector map overlay and grid may not be fully supported in this view. |
| Colors Traditional / White peaks / Simple / Vivid / Rainbow / ... | A color scheme for the elevation map. 'Unique' assigns unique colors for each elevation band. |
| Palette Smooth / Layered | If 'layered', then fewer colors are used, which makes elevation differences more apparent. See also menu: Map/Map legend. |
| 3D opacity | Choices: Low / Low, high contrast / High |
menu: Settings/Elev. advanced
Settings from this section are stored in individual sessions that you can save and restore at any time.
| Color scale Adaptive / Absolute | For adaptive color scale, colors are adjusted to the minimum and maximum elevation levels in the currently loaded map. Absolute scale colors are fixed (i.e. red color assigned to 5000m will only appear on maps containing 5000m elevations). |
| Water level −50m / −25m / Normal / +25m / +50m | Lets you see the planet as if the datum level (or global water level) has increased or decreased. (not saved in sessions) |
| 3D height Low / Medium / High | The height of the 3D terrain model. |
| 3D skew Low / Medium / High | The tilt (angle) of the 3D terrain model. |
menu: Vector/Settings
Settings from this section are stored in individual sessions that you can save and restore at any time.
| Gradient start color | The three gradient colors make a gradient which is used to shade objects according to their selected property. The gradient is also used in the 'Color by random gradient' mode. See menu: Vector/Layers/Color by. |
| Gradient middle | color |
| Gradient end | color |
| Draft mode Off / On | In the draft mode, complex vector shapes are drawn simplified and faster. In the draft mode, shape fill is not automatically adjusted. Automatic adjustment is random color fill when no raster data, outline otherwise. |
| Load databases? No / Yes | If you choose not to load databases, then features of objects (like their names etc.) are not loaded. This saves memory and speeds up loading. (not saved in sessions) |
menu: Vector/Weather
Settings from this section are stored in individual sessions that you can save and restore at any time.
| Label 1 (string) | You can build your custom weather labels from available weather data. These labels are used when online weather is displayed for locations. Use '+' to join your own text and available weather variables (like location_city or astronomy_sunrise). The list of weather variables (names and sample values) is provided below: location_city = Rome location_country = IT condition_text = Clear condition_temp = 43 wind_chill = 40 wind_direction = 70 wind_speed = 5 astronomy_sunrise = 7:38 am astronomy_sunset = 4:48 pm atmosphere_humidity = 87% atmosphere_pressure = 30.50 atmosphere_rising = steady atmosphere_visibility = 6.0mi forecast1_code = 31 forecast1_date = 29 Dec 2007 forecast1_day = Fri forecast1_high = 59 forecast1_low = 37 forecast1_text = Clear forecast2_code = 32 forecast2_date = 30 Dec 2007 forecast2_day = Sat forecast2_high = 59 forecast2_low = 40 forecast2_text = Sunny units_distance = mi units_pressure = in units_speed = mph units_temperature = °F So, a sample label that displays sunrise and sunset times for each location is: astronomy_sunrise+.. +astronomy_sunset and it produces the actual label 7:38 am..4:48 pm |
| Label 2 (string) | See help for 'Label 1'. |
PrettyMap built-in synchronization of user maps
Since PrettyMap v5, you can synchronize user maps so that they contain the same information. This is useful when you want to join information from two or more maps. It is also helpful when many people are gathering and editing data, and a single "master" map is built. Synchronization takes care of appropriate updating of locations both ways, and adding/removing them based on the "last modified" timestamps that are associated with each location. Therefore each party can edit, add and remove locations freely. Potential conflicts (when both parties modified the same location) are also detected and reported (the most recent change wins a conflict). All parties should take care to set accurate date, time and time zone on their devices.
Note that synchronization cannot be undone. You can perform a test sync to see the summary of changes without actually committing them.
It is strongly recommended that you synchronize maps created/modified in PrettyMap v5. Maps created with PrettyMap v4 have a simpler file format that imposes the following restriction. When you synchronize, you select a client map and a master map. Once you synchronize a v4 client map with some master map, you must always synchronize this client map with the same master map.
Generally, for best results, it is recommended to consequently use the same master map for a client map. Each time you use a different master map for some client map, deletions of locations may not be properly detected as the information about the "last sync" timestamp will be missing. It is a good idea to set a distinct name of the master map – e.g. "MASTER MAP" or "Bus stops (MASTER)". You can also set a specific category name, like "Shared.busstops".